Date: May 8th, 2023
Class: CS598 Deep Learning for Healthcare @ UIUC
Project Summary
This repository is our attempt at reproducing the experiments in Learning Unsupervised Representations for ICU Timeseries.
Addison Weatherhead, Robert Greer, Michael-Alice Moga, Mjaye Mazwi, Danny Eytan, Anna Golden- berg, and Sana Tonekaboni. 2022. Learning Unsupervised Representations for ICU Timeseries. In Pro- ceedings of the Conference on Health, Inference, and Learning, volume 174 of Proceedings of Machine Learning Research, pages 152–168. PMLR.
Much of our code is sourced from TRACE Github Repo which is the original implementation of the experiments from this paper.
The link to the github repo is here.
Reproducibility Summary
The original paper introduces a new unsupervised representation learning method called TRACE which builds on the TNC (Temporal Neighborhood Coding) framework to produce better predictions on ICU data.
The claim we picked from the paper to test is that TRACE will have higher accuracy than baseline models including TNC, CPC, T-Loss, and Supervised with end-to-end encoding on label prediction.
In our attempts to reproduce the paper we were able to prove the claim that TRACE would have a higher accuracy than baseline models in predicting labels, and we were able to do so on a different dataset than what was used in the original paper. This is compelling evidence that the model introduced by the original paper can be used in general for ICU data. Visualization of data statistics
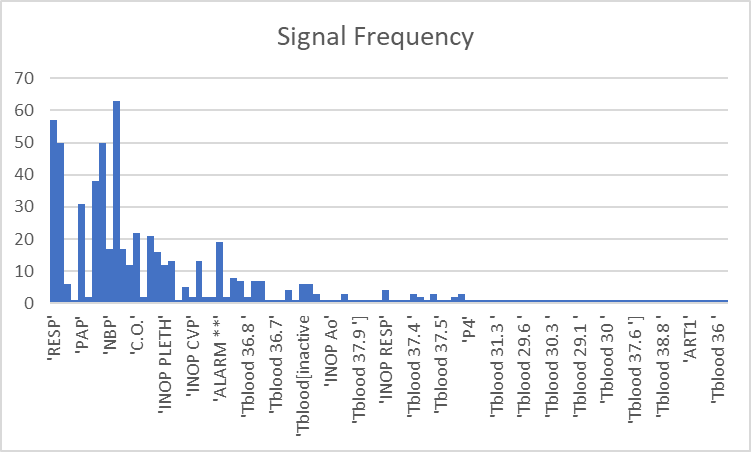
There were many different signals present for each patient in the data. Not all of them were present in every patient, meaning if we used all the features there would be a lot of sparseness in the data. With most of the signals appearing only once in a patient, it made sense to cut out some of them as they only provide noise to the model.
In the below chart, the y-axis represents the number of patients that the signal was present, and the x-axis represents each signal.
Visualization of data statistics
There were many different signals present for each patient in the data. Not all of them were present in every patient, meaning if we used all the features there would be a lot of sparseness in the data. With most of the signals appearing only once in a patient, it made sense to cut out some of them as they only provide noise to the model.
In the below chart, the y-axis represents the number of patients that the signal was present, and the x-axis represents each signal.

Methodology explanation and examples
We plan to re-implement the models from the paper ourselves while using the authors’ code as reference. These include the aforementioned models TRACE, CPC, T-Loss, and Supervised E2E.
The authors provide a link to a GitHub repository with their code, including some light documentation covering how to create the encoding for the specific data set they used. We will be using the MIMIC dataset Moody and Mark (1996) as we were unable to get access to the HiRID dataset before the project deadline.
Due to this change in our data source, this meant that we were unable to use the data processing used by the original paper. Instead we did a data exploration of the MIMIC dataset and processed it ourselves with our own code implementation from scratch. This was time-consuming and labor-intensive, not to mention that we also had to change parts of the model implementation to account for the data we generated from MIMIC.
Label Generation Code
To check our model accuracy, we generated labels based on the ”PULSE” signal having 0 values present for a patient’s time-series data, indicating that they experienced a cardiac arrest event. If the patient had no 0 values present in their time-series data for the ”PULSE” signal, then we know that they did not have a cardiac arrest event. A label of 0 means the patient did not have a cardiac arrest event, and a label of 1 means the patient did.
import os

def get_patient_labels():
    """ loop through patient folders and get label for each one

    Returns:
        dict: dictionary of patients and their labels
    """
    patient_labels = {}
    first_cardiac_arrest_records = {}

    for folder_name in os.listdir(os.path.join(os.getcwd(), "mimic-database-small-version")):
        if folder_name.isdigit():
            print(f"Getting label for patient name: {folder_name}")
            # loop through every file
            had_cardiac_arrest, first_cardiac_arrest_record = get_had_cardiac_arrest(folder_name)
            if had_cardiac_arrest:
                patient_labels[folder_name] = 1
                first_cardiac_arrest_records[folder_name] = first_cardiac_arrest_record
            else:
                patient_labels[folder_name] = 0
    return patient_labels, first_cardiac_arrest_records


def get_had_cardiac_arrest(folder_name):
    """ gets cardiac arrest boolean from files in patient folder

    Args:
        folderName (str): the name of the folder

    Returns:
        boolean: whether the patient had a cardiac arrest event
    """
    file_names = os.listdir(os.path.join(os.getcwd(), "mimic-database-small-version", folder_name))
    pulse_record_ct = 0
    for file_name in file_names:
        # if the file name ends with txt
        if file_name.endswith((".txt")):
            file_path = os.path.join(os.getcwd(), "mimic-database-small-version", folder_name, file_name)
            with open(file_path, 'r', encoding='utf-8') as f:
                lines = f.readlines()
                for line in lines:
                    if line.startswith(("PULSE")):
                        pulse_record_ct += 1
                        reading = line.split("\t")
                        if len(reading) >= 2:
                            pulse = int(reading[1])
                            if pulse == 0:
                                return True, pulse_record_ct
    return False, None

def write_labels_to_file(patient_labels, first_cardiac_arrest_records):
      for patient, label in patient_labels.items():
          print(f"Patient {patient} has label: {label}")
patient_labels, first_cardiac_arrest_records = get_patient_labels()
write_labels_to_file(patient_labels, first_cardiac_arrest_records)
This is different from the original paper as in the original paper they try to predict cardiopulmonary arrest and mortality labels. Cardiopulmonary arrest is the cessation of breathing and circulation. This would have been more difficult to generate labels for due to the low number of quality signal types and the lack of a clear definition of mortality in relation to those signals. By quality, we refer to the low number of common signals between patients.
Therefore it made sense to use only one of our quality signals to generate labels instead of two, as we are only interested in how TRACE performs in comparison to baseline models, rather than on the labels themselves.
Data Generation Code
We also had to generate usable data from the raw data files from MIMIC. In order to do this we looped through each patient folder’s files line by line, and extracted all the features that we wanted to use for our model.
import os

def write_patient_data():
    """ loop through patient folders and get label for each one

    Returns:
        dict: dictionary of patients and their labels
    """
    patient_labels = {}
    valid_patients = ['211', '471', '476', '449', '041', '413', '414', '221', '226', '415', '401', '408', '260', '409', '055', '037', '039', '248', '417', '212', '472', '240', '418', '427', '474', '442', '213', '231', '253', '254', '291', '237', '230', '466', '403', '252']

    valid_patients_labels = dict()
    first_cardiac_arrest_records = dict()

    with open('mimic-database-small-version/labels.csv', 'r', encoding='utf-8') as f:
        lines = f.readlines()
        for line in lines:
            patient_id, label = line.split(",")
            label = int(label)

            if patient_id in valid_patients:
                valid_patients_labels[patient_id] = label

    with open('mimic-database-small-version/first_cardiac_arrest_record.csv', 'r', encoding='utf-8') as f:
        lines = f.readlines()
        for line in lines:
            patient_id, index = line.split(",")
            index = int(index)

            if patient_id in valid_patients:
                first_cardiac_arrest_records[patient_id] = index


    for folder_name in os.listdir(os.path.join(os.getcwd(), "mimic-database-small-version")):
        if folder_name.isdigit() and folder_name in valid_patients:
            print(f"Getting data for patient name: {folder_name}")
            # loop through every file
            patient_data = get_data_per_patient(folder_name)
            write_data_to_file(folder_name, patient_data, valid_patients_labels, first_cardiac_arrest_records)


    return patient_labels

def get_data_per_patient(folder_name):
    """Gets data for each patient in terms of columns

    Args:
        folder_name (str): patient name
    Returns:
        dict<str, list>: dictionary signal names as keys and a list of values for each signal in order
    """
    patient_data = {}
    file_names = os.listdir(os.path.join(os.getcwd(), "mimic-database-small-version", folder_name))
    for file_name in file_names:
        # if the file name ends with txt
        if file_name.endswith((".txt")):
            file_path = os.path.join(os.getcwd(), "mimic-database-small-version", folder_name, file_name)
            with open(file_path, 'r', encoding='utf-8') as f:
                lines = f.readlines()
                for line in lines:
                    if line.startswith(("SpO2")) or line.startswith(("RESP")) or line.startswith(("HR")) or line.startswith(("ABP")):
                        reading = line.split("\t")
                        if len(reading) == 2:
                            signal = reading[0].strip()
                            value = int(float(reading[1]))
                            #print(f"Signal: {signal}, Value: {value}")
                            if signal != "ABP":
                                if signal not in patient_data:
                                    patient_data[signal] = [value]
                                else:
                                    patient_data[signal].append(value)
                            else:
                                if "ABP1" not in patient_data and "ABP2" not in patient_data and "ABP3" not in patient_data:
                                    patient_data["ABP1"] = [value]
                                    patient_data["ABP2"] = [value]
                                    patient_data["ABP3"] = [value]
                                else:
                                    patient_data["ABP1"].append(value)
                                    patient_data["ABP2"].append(value)
                                    patient_data["ABP3"].append(value)
                        elif len(reading) > 2:
                            values = reading[1:]
                            for index, value in enumerate(values):
                                currentABP = f"ABP{index+1}"
                                #print(f"Signal: {currentABP}, Value: {value}")
                                if currentABP not in patient_data:
                                    patient_data[currentABP] = [int(value)]
                                else:
                                    patient_data[currentABP].append(int(value))
    return patient_data

def write_data_to_file(patient_id, patient_data, valid_patients_labels, first_cardiac_arrest_records):
    # find which patients are positive and negative
    NUM_RECORDS = 10000

    with open(f'mimic-database-small-version/valid_patient_data/{patient_id}_data.csv', 'w', encoding='utf-8') as f:
        temp_record = {}
        record_number = None
        if valid_patients_labels[patient_id] == 0:
            record_number = NUM_RECORDS
        else:
            record_number = max(NUM_RECORDS, first_cardiac_arrest_records[patient_id])

        signal_list = ["SpO2", "RESP", "HR", "ABP1", "ABP2", "ABP3"]
        print("record_id,SpO2,RESP,HR,ABP1,ABP2,ABP3")

        for record_id in range(record_number-NUM_RECORDS,  record_number):
            for signal in signal_list:
                temp_record[signal] = patient_data[signal][record_id]
            if record_id % 1000 == 0:
                print("{},{},{},{},{},{},{}".format(record_id+1, temp_record["SpO2"], temp_record["RESP"], temp_record["HR"], temp_record["ABP1"], temp_record["ABP2"], temp_record["ABP3"]))
write_patient_data()
TRACE Overview
The TRACE method is a simplified contrastive learning objective to train the model. The goal of contrastive learning is to learn a representation of input data that captures the underlying structure of the data by contrasting pairs of similar and dissimilar examples. The representation maps similar data points closer together in the representation space and maps dissimilar data points further apart. The objective in the context of our data is to label which patients experienced a cardiac arrest event over time series data. The objective in general is fluid, and labels can be created for any particular event related to the data.
The model consists of two neural networks, the encoder and the discriminator. The encoder is a dilated causal convolutional neural network with 4 layers; MaxPool1d, Squeeze, Linear, and Sequential layers. The discriminator is a simple single layer Multi-Layer Perceptron. The encoder and the discriminator both have 7 defined parameters.
in-channels = 6; this represents the 6 physiological signals which we use to make predictions based on: SpO2, Respiratory Rate, Heart Rate, and 3 types of ABP measures.
channels = 4; this represents the number of channels manipulated by our encoder.
depth = 1; the depth of the input layer is only 1 because they are simple numeric data.
reduced-size = 2; this is the length to which the output time series of the encoder is reduced.
encoding-size = 10; this is the number of output channels for our encoder.
kernel-size = 2; this is the kernel size for our encoder which is a CNN.
window-size = 12; this represents the amount of data to encode at a time, in this case, we encode 12 entries at a time.
The encoder has additional features, including filters that are exponentially dilated meaning deeper layers have filters that have been stretched out, leading to a larger receptive field, while making sure the output at time t is only reliant on time series data up to time t. When generating an encoding for a window Wt, the encoder is also fed the missing data mask to incorporate that information into its learning.
Initializing Parameters and Importing Dependencies
import torch

from cpc import cpc
from end_to_end import end_to_end
from trace_model import trace
from triplet_loss import triplet_loss

# Interval between recordings
interval = 1

# Setting hyperparams
encoder_type = "CausalCNNEncoder"

# Learn encoder hyperparams
window_size = 60
w = 0.05
batch_size = 30
lr = .00005
decay = 0.0005
mc_sample_size = 6
n_epochs = 150
data_type = "mimic"
n_cross_val_encoder = 1
ETA = 4
ADF = False
ACF = False
ACF_PLUS = True
ACF_nghd_Threshold = 0.6
ACF_out_nghd_Threshold = 0.1

# CausalCNNEncoder Hyperparameters
CausalCNNEncoder_in_channels = 6
CausalCNNEncoder_channels = 4
CausalCNNEncoder_depth = 1
CausalCNNEncoder_reduced_size = 2
CausalCNNEncoder_encoding_size = 10
CausalCNNEncoder_kernel_size = 2
CausalCNNEncoder_window_size = 12

n_cross_val_classification = 3

encoder_hyper_params = {'in_channels': CausalCNNEncoder_in_channels,
                            'channels': CausalCNNEncoder_channels,
                            'depth': CausalCNNEncoder_depth,
                            'reduced_size': CausalCNNEncoder_reduced_size,
                            'encoding_size': CausalCNNEncoder_encoding_size,
                            'kernel_size': CausalCNNEncoder_kernel_size,
                            'window_size': CausalCNNEncoder_window_size}

learn_encoder_hyper_params = {'window_size': window_size,
                                'w': w,
                                'batch_size': batch_size,
                                'lr': lr,
                                'decay': decay,
                                'mc_sample_size': mc_sample_size,
                                'n_epochs': n_epochs,
                                'data_type': data_type,
                                'n_cross_val_encoder': n_cross_val_encoder,
                                'cont': True,
                                'ETA': ETA,
                                'ADF': ADF,
                                'ACF': ACF,
                                'ACF_PLUS': ACF_PLUS,
                                'ACF_nghd_Threshold': ACF_nghd_Threshold,
                                'ACF_out_nghd_Threshold': ACF_out_nghd_Threshold}


classification_hyper_params = {'n_cross_val_classification': n_cross_val_classification}

device = 'cuda' if torch.cuda.is_available() else 'cpu'

if 'device' not in encoder_hyper_params:
        encoder_hyper_params['device'] = device

if 'device' not in learn_encoder_hyper_params:
    learn_encoder_hyper_params['device'] = device

pretrain_hyper_params = {}

print("ENCODER HYPER PARAMETERS")
for key in encoder_hyper_params:
    print(key)
    print(encoder_hyper_params[key])
    print()
print("LEARN ENCODER HYPER PARAMETERS")
for key in learn_encoder_hyper_params:
    print(key)
    print(learn_encoder_hyper_params[key])
    print()
Training and Evaluating TRACE Model
print("Executing TRACE model ...")
trace(data_type, encoder_type, encoder_hyper_params, learn_encoder_hyper_params, classification_hyper_params, pretrain_hyper_params)
print("TRACE model finished")
print()
CPC Model Code
print("Executing CPC model for comparison ...")
cpc(data_type, lr=0.0001, cv=1)
print("CPC model finished")
print()
T-Loss Code
print("Executing Triplet-Loss model for comparison ...")
triplet_loss(data_type, 0.0001, 1)
print("Triplet-Loss model finished")
print()
Supervised E2E Code
print("Executing End-to-End model for comparison ...")
end_to_end(data_type, 3)
print("End-to-End model finished")
print()
Illustration of the results

From our results it is clear that TRACE outperforms the other models. It has a better AUROC and AUPRC score compared to the other models we chose as baselines. This proves our claim/hypothesis that TRACE would outperform all the baseline models
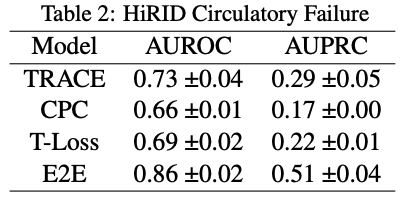
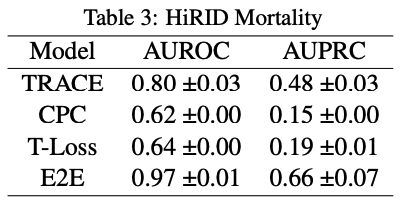
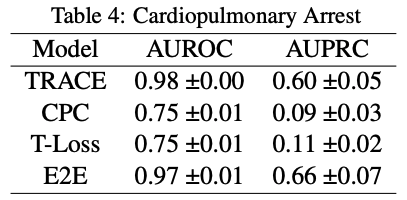
These were the results from the original paper:


Comparing to our own results, it is interesting to note that AUPRC score does not go above 0.5 for any of the models in the original paper. This means that the model performs worse than random chance at making positive predictions. Comparing that to the performance on the MIMIC dataset, our AUPRC scores overall are much higher in comparison.
On the other hand, AUROC scores across the board are much lower for all models. There is an especially stark difference between E2E for the MIMIC and HiRID data-sets. This means that our models in comparison to the original paper’s models are less likely to make predictions accurately, this especially being true for E2E.
The original paper shows a significant difference in performance metrics for TRACE compared to the other models, and that trend is even more apparent in our own experiment. Given the results, it is fair to say that our experiment supports the original paper’s hypothesis that TRACE or patient representation learning is useful as a model and can be generalized to any labels that could be created for data.
References
Jean-Yves Franceschi, Aymeric Dieuleveut, and Martin Jaggi. 2020. Unsupervised scalable representation learn- ing for multivariate time series. In 33rd Conference on Neural Information Processing Systems.
George B. Moody and Roger G. Mark. 1996. A database to support development and evaluation of intelligent intensive care monitoring. In Computers in Cardiology 23:657-660.
Aaron van den Oord, Yazhe Li, and Oriol Vinyals. 2019. Representation learning with contrastive predictive cod- ing. In Preprint.
Sana Tonekaboni, Danny Eytan, and Anna Goldenberg. 2021. Unsupervised representation learning for time series with temporal neighborhood coding. In Interna- tional Conference on Learning Representations.
Addison Weatherhead, Robert Greer, Michael-Alice Moga, Mjaye Mazwi, Danny Eytan, Anna Goldenberg, and Sana Tonekaboni. 2022. Learning unsupervised representations for icu timeseries. In Proceedings of the Conference on Health, Inference, and Learning, vol- ume 174 of Proceedings of Machine Learning Research, pages 152–168. PMLR.